

You are viewing a single thread.
View all comments 1 point
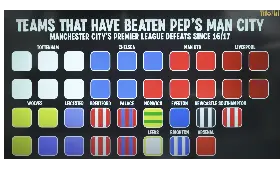
Wonder if they could make this any more confusing.
1 point
1 point
What’s confusing about it? You count the amount of same coloured squares below the team name and you get the number of times Pep has lost to that team
1 point
1 point
1 point
I agree, they’ve opted for a tighter grid instead of more clarity. Yes you can figure it out but the point of infographics is to make data more accessible not convolute it for the sake of a more structured design.
I wonder if they’d gone for a single column, vertical style it’d be a lot easier to decipher!

![[Tifo IRL] Teams that have beaten Pep's Man City- Premier League defeats since 16/17(alien.top)](https://alien.top/pictrs/image/234b8edd-fbf3-4183-aad4-ab01498612b8.webp)