

6 points
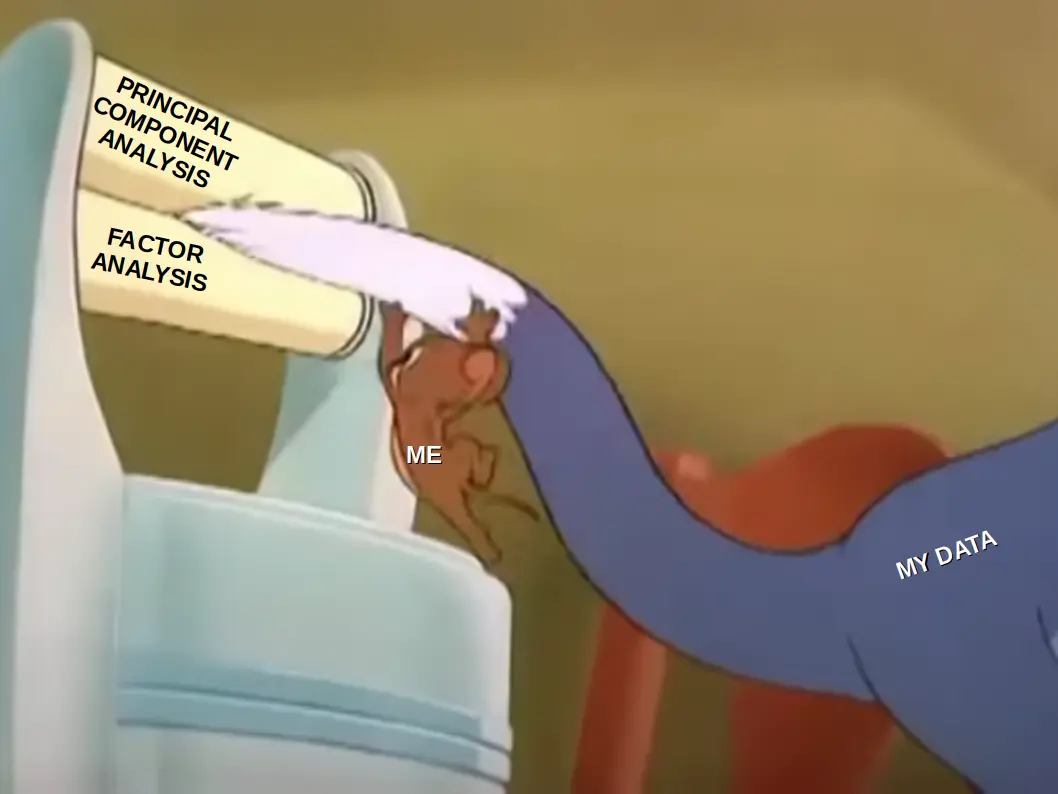
Image Transcription: A scene from the Tom and Jerry cartoon, with Jerry as the narrator pushing Tom’s tail in between two cogs. Tom is labelled ‘Data’ and the cogs are ‘Principal Component analysis’ and ‘Factor Analysis’.
5 points
Meaningful variation: bye bye
5 points
3 points
How else am I supposed to visualize my 76 dimensional data?


