


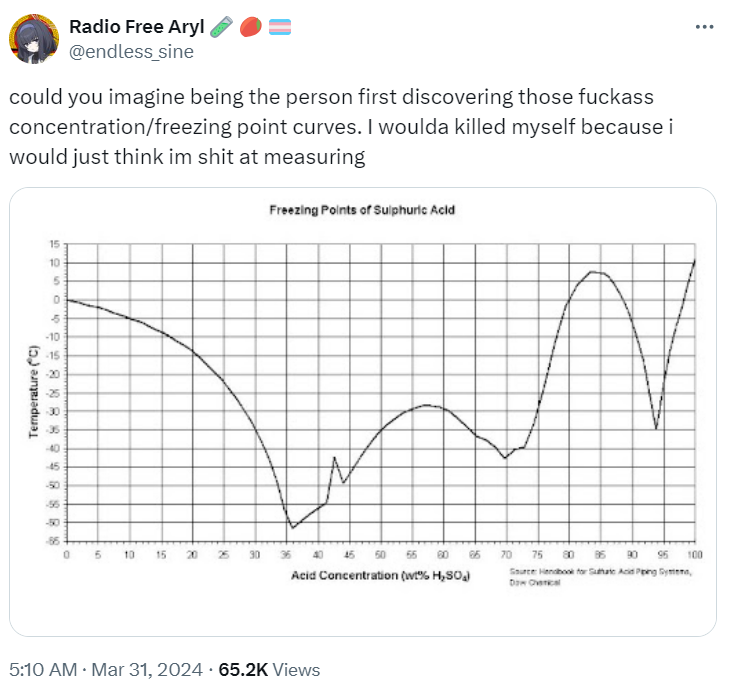
Dare someone smarter than me explain what the ever loving fuck is going on there?
Sulfuric acid and water has various H2SO4 and H2O ratios. So like 1 H2SO4 and 6, 3, 2, or 1 H2O it also has just the H2SO4 and H2S2O7. These are present as local points within solutions and with different prominence depending on the amount of water added. These 8 different ratios each have different freezing points.
If I had to guess, I would assume that there are different molecular lattices that sulfuric acid and water can form at different concentrations and that these different lattices have different freezing points. I will now go look it up.

This is what happens when some kind of new compound is formed between these two, here it’ll be series of sulfuric acid-water complexes. Same thing happens with metals when intermetallic compounds form, see titanium-nickel phase diagram. Normal case would be eutectic, see aluminum-silicon phase diagram
I see. So these are actually many sulfuric compounds in a trenchcoat chart.
My uneducated understanding is that the chart shows at which temperatures sulfuric acid freezes depending on the concentration. Also in my very basic understanding of physics and chemistry I would have thought that it’s linear or exponential or something predictable and not that jumpy.
Here’s what a normal curve looks like:
https://i2.wp.com/www.storksplows.com/docs/wp-content/uploads/2017/04/Brine-Pro-salinity-chart.png

