

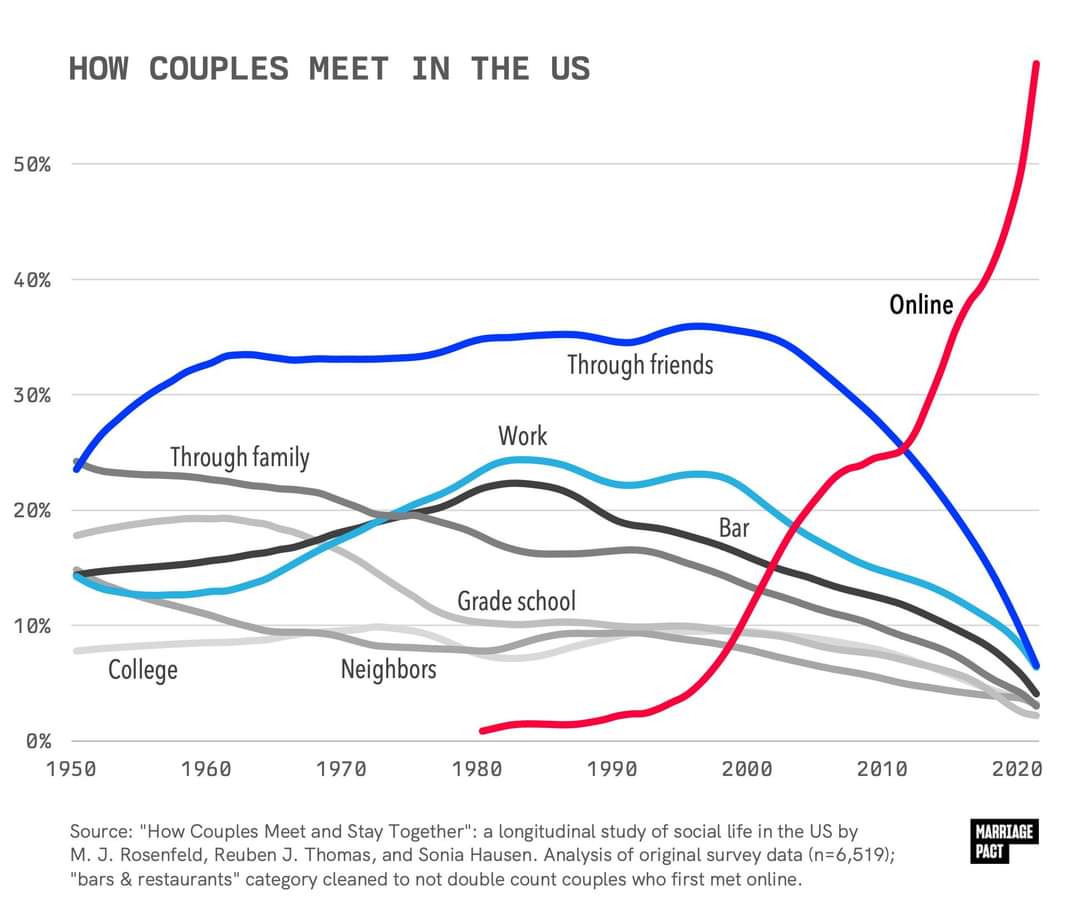
It’s been trending this way for years, but seeing it graphed out like this is shocking.
What do you think are the effects of this drastic change?
I want to know which couples were meeting online in 1980.

Bulletin board systems (BBS) go back to 1980. Men have tried everything to get laid since the dawn of humanity. It checks out.
As someone who was using BBSs by 1984-ish, I can believe that people met this way. What I can’t believe is that it was at a percentage high enough to be represented as anything above zero on that graph.
I think this is the data collection info: https://data.stanford.edu/hcmst2017
The data are nationally representative, as the Ipsos KnowledgePanel recruits subjects into the panel by by Address Based Sampling, and subjects without Internet access at home are given Internet access.
…
Response rate was 3510/6753=52% in 2017, 2107/2431= 87% in 2020, and 1722/2073=83% in 2022.
Half of all randomly selected subjects (by address) responded to their survey? I’d need to read a bit more about what exactly is going on there.

University nerds with early access to early forms of Internet would definitely never utilize such serious world changing technology to chat and dawdle amongst themselves to the point a connection would form. It’s not like the entirety of video gaming was created by a nerd severely misusing an extremely expensive oscilloscope.


