152 points

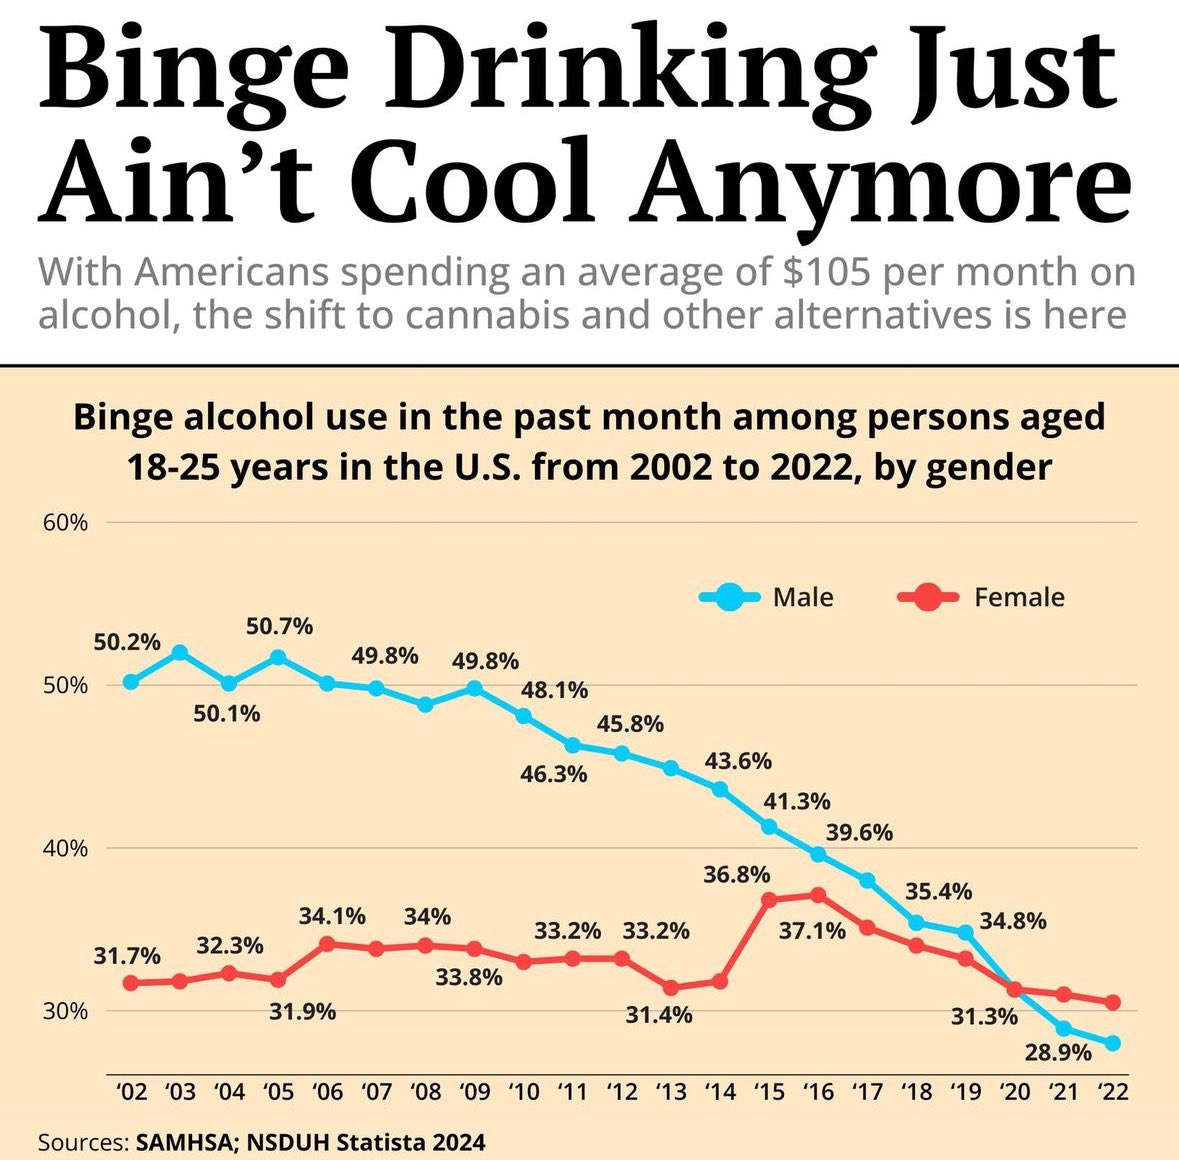
Shoutout to the spike in women drinking when Trump got elected

Correlation is not causation, but…

permalink
report
reply
59 points

The election was 15-16. Spike happened 14-15. Wondering if it was a methodology change to jump that much in 1 year?

Also fuck me but that was already 10 years ago. Was trying to recall if there was maybe some kind of viral social media thing that might have happened in 2014.

permalink
report
parent
reply
21 points

Gamergate

permalink
report
parent
reply
8 points

Robin Williams killed himself and Bill Cosby was arrested.

permalink
report
parent
reply
6 points

The text is to the left on '15; zoom in and compare the circles to the year. It was a 15-16 jump according to the dots.

permalink
report
parent
reply
2 points

The dot above 2014 isn’t labeled. I’d guess it’s about 31.7%. The dot above 2015 is 36.8%. That’s far and away the largest year-over-year change and the jump I’m referring to.

2016 is the peak. But it’s only barely slightly higher than 2015.

permalink
report
parent
reply
5 points

Was there one of the several “once in a lifetime” economic crashes that year? I can’t remember, but that was my first thought.

permalink
report
parent
reply
4 points

Don’t think so. By 14 we were pretty well out of the 08 mess. Was around when I got my first major career break. Which was nice as one of the millennials that finished college while the economy had gone to shit.

permalink
report
parent
reply
1 point

The advent of white claw

permalink
report
parent
reply
113 points

Obligatory NYT headline: “Alcohol poisoning used to be a time honoured pasttime in this small town, but Millennial woke mob took it all away.”

permalink
report
reply
73 points

I think at least part of it is due to weed. Both it being legalized and being more popular than it’s ever been in non-legal states. At least for me, smoking weed kills my desire to drink nearly as much. Usually at parties or just hang outs it starts off with a beer or mixed drink or three, then someone breaks out the weed and suddenly I’m nursing my fourth drink for an hour.

permalink
report
reply
13 points

Would we not expect sudden changes then? This is a steady decline, not indicating any sudden changes in laws or anything.

permalink
report
parent
reply
27 points

Weed legalization hasn’t been sudden though. It’s progressed from medical to decriminalized to legal state by excruciating state.

As this graph is national, it makes sense that there wouldn’t be a cliff because there’s no particular date when we could say weed became legal.

Still not legal in any way here in texasss, and I assume we’ll be the very last of the last to do so. But even here, it’s so easily accessible that a good number of younger people I know tell me they prefer weed to alcohol. In legal states, that tendency must be much higher.

permalink
report
parent
reply
2 points

Do we have the same date for individual states? Perhaps some with and some without legal weed?

permalink
report
parent
reply
6 points

Legalization efforts have been piecemeal throughout the country, and still less than half the states have direct recreational access. I’m sure it’s a factor, but until we have federal recreational legalization, we should see a downward trend instead of a drop.

permalink
report
parent
reply
2 points
*

Weed has had a steady increase in popularity since like the 70s. I kind of agree, I’m sure there should be some cliff in the states where it was legalized, or if not my theory is bunk. It’s only based on an anecdote tbf.

Edit: actually if we want any theory it seems pretty clear that the beginning of the drop off started right about at the market crash of 2008.

Also interesting that female rates stayed steady to the point that they’ve actually overtaken male rates.

permalink
report
parent
reply
5 points

Interesting. Personally, it doesn’t kill my desire to drink when I do decide to go on a bender. If anything, for me it gets easier to drink when there’s weed involved, as I just don’t enjoy most alcoholic beverages, taste wise. However, since access to weed got easier and I don’t have to hide anymore, when the occasion to get a buzz happens, I just prefer the weed high to being drunk, and I can skip the hangover.

permalink
report
parent
reply
2 points

I think it’s also in part due to easier access at an earlier age compared to alcohol and the rapid increase in quality. Weed is easy to grow, and even kids have been selling it to their friends in school for forever. But gone are the days of buying skunk weed off some dude you barely know. There’s 13 year olds out there today smoking stuff of a quality that the hippies could only dream of.

Plus, when it comes to drugs, as a late Millennial, I knew a lot more kids who became heroin addicts as teenagers than alcoholics - and they started their drug use years before showing up on this graph. During Bush’s presidency, heroin from Afghanistan became a lot more easily accessible on the east coast, and I used to say when I was a teenager that heroin was more popular with my generation because it was too awkward to go to the bar and see your friends’ parents day drinking.

permalink
report
parent
reply
2 points

I’m not sure how it all factors in but there’s evidence that teenagers are using weed less: https://coloradosun.com/2024/06/26/youth-marijuana-use-colorado-legalization/

permalink
report
parent
reply
2 points

The graph maker certainly seems to think so at least

the shift to cannabis and other alternatives is here

permalink
report
parent
reply
59 points

I’m shocked there’s no bump in 2020-2021. Many people I know, myself included, started drinking so much more during the pandemic.

permalink
report
reply
25 points

These are also self reported numbers.

I know I wasn’t telling people how much I was drinking during the pandemic

permalink
report
parent
reply
5 points

I wonder if that could be the entire cause od the drop, the stigma became greater so men just lie about it.

permalink
report
parent
reply
12 points

Also how are we defining “binge” drinking

permalink
report
parent
reply
6 points

In the 18-25 age bracket though?

permalink
report
parent
reply
6 points

I found people went one of two ways. I know plenty of people who drank more, but also plenty of people (myself included) who basically went cold turkey for two years. I don’t enjoy drinking by myself so I didn’t

permalink
report
parent
reply
4 points

Same

permalink
report
parent
reply
51 points

It went from 50% to 30% which is less but the scale makes you feel it is much lower

permalink
report
reply
25 points

Yeah, graphs that are cut off is misleading graphs 101.

permalink
report
parent
reply
22 points

Sometimes you just have to trust the audience to be literate. A 20% drop is very significant, it’s not like they’re trying to make a .5% decline look like the Temperance movement.

permalink
report
parent
reply
5 points

Trust the audience to be literate

But really, that depends on the intended audience.

permalink
report
parent
reply
8 points

Yeah and also its a decline in male binge drinking. Female hasn’t really changed after a short term uptick.

permalink
report
parent
reply
2 points

that’s still an overall decline.

permalink
report
parent
reply

Data is Beautiful

!dataisbeautiful@lemmy.world

Create post

A place to share and discuss visual representations of data: Graphs, charts, maps, etc.

DataIsBeautiful is for visualizations that effectively convey information. Aesthetics are an important part of information visualization, but pretty pictures are not the sole aim of this subreddit.

A place to share and discuss visual representations of data: Graphs, charts, maps, etc.

  A post must be (or contain) a qualifying data visualization.

  Directly link to the original source article of the visualization
    Original source article doesn't mean the original source image. Link to the full page of the source article as a link-type submission.
    If you made the visualization yourself, tag it as [OC]

  [OC] posts must state the data source(s) and tool(s) used in the first top-level comment on their submission.

  DO NOT claim "[OC]" for diagrams that are not yours.

  All diagrams must have at least one computer generated element.

  No reposts of popular posts within 1 month.

  Post titles must describe the data plainly without using sensationalized headlines. Clickbait posts will be removed.

  Posts involving American Politics, or contentious topics in American media, are permissible only on Thursdays (ET).

  Posts involving Personal Data are permissible only on Mondays (ET).

Please read through our FAQ if you are new to posting on DataIsBeautiful. Commenting Rules

Don't be intentionally rude, ever.

Comments should be constructive and related to the visual presented. Special attention is given to root-level comments.

Short comments and low effort replies are automatically removed.

Hate Speech and dogwhistling are not tolerated and will result in an immediate ban.

Personal attacks and rabble-rousing will be removed.

Moderators reserve discretion when issuing bans for inappropriate comments. Bans are also subject to you forfeiting all of your comments in this community.

Originally r/DataisBeautiful

Community stats

  • 2.7K

    Monthly active users

  • 74

    Posts

  • 1.5K

    Comments